Project explanations
About the Project
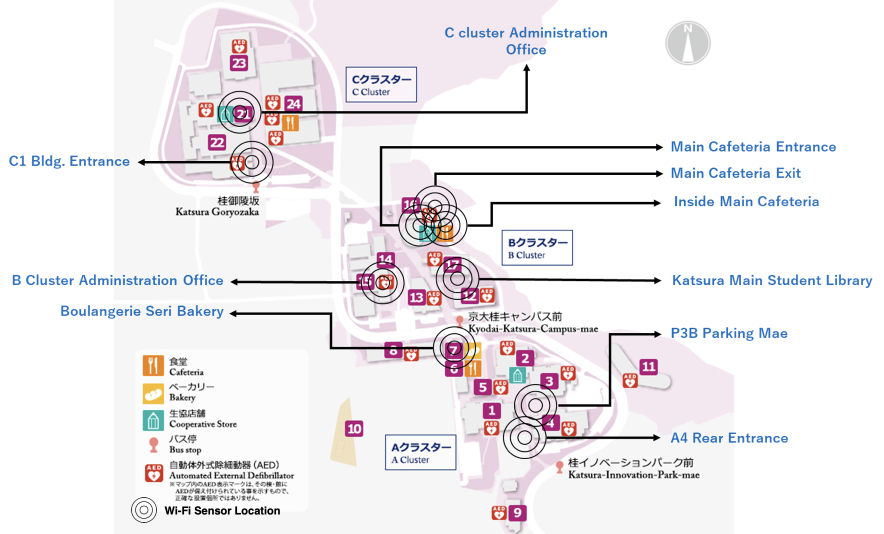
Understanding the crowding phenomenon at open, confined and semi-confined spaces during operational hours, is highly consequential for informed trip scheduling and more efficient management of such sites subject to crowd traffic in an institutional setting such as Katsura Campus. In this study, our main objective is to utilize Wi-Fi sensor data to predict crowding at the Main Student Cafeteria (Cafeteria Selene) at Katsura Campus during the Lunch break operational period (11:00 AM - 2:00 PM). The purpose of this Experiment is to enhance a better understanding of the crowding phenomenon at the Cafeteria and to assess the value of the crowd forecast information prior to trip scheduling. Some of the expected project outcomes include but are not limited to shorter waiting times manifesting through shorter queue lengths and an overall better end-user experience. Additional crowd traffic information during both the designated and undesignated operational hours at other access points (other locations), within Katsura Campus has been provided with brief location descriptions and useful links information to encapsulate what is now referred to as “Katsura Campus Wi-Fi Times”.
Sensors map
About Wi-Fi packet sensors and Wi-Fi sensor data
Wi-Fi sensors are relatively small, low-cost, low power devices integrated with a dual set of Wi-Fi sniffers, built upon the Raspberry Pi Model B with an additional Wi-Fi USB dongle for passive collection of Bluetooth and Wi-Fi probe requests spontaneously emitted by Wi-Fi configurable devices such as Smartphones within the influence area of the Wi-Fi packet sensor. Preliminary raw data handling involves the re-configuration of the identities of the captured devices by replacing their original MAC(Media Access Control) addresses with anonymized identifiers (AMACs) consisting of unique arrays of number-letter combinations. The processed probe request records are then uploaded through the long term evolution(LTE) connection to the central server. Each record contains the; Unix Time, Timestamp, Anonymized Media Access Control (AMAC), Bluetooth Signal Parameter(SC), Received Signal Strength Indicator (RSSI), Organizational User Identifier (OUI) and the Unique Access point identifier (AMPID). These records are then retrieved locally and further preprocessed by aggregating the AMAC counts for different time intervals prior to analyzing various aspects of the “crowd” such as presence, movement and density.
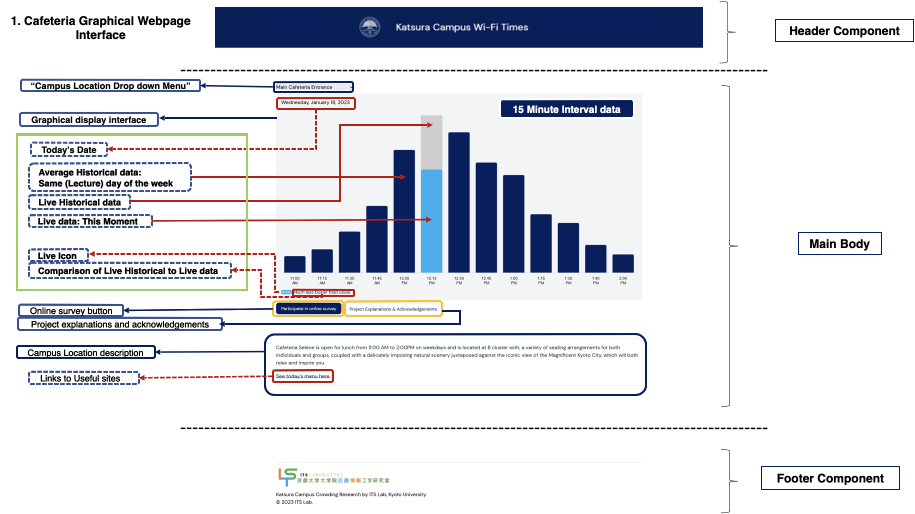
About the graphical display interface
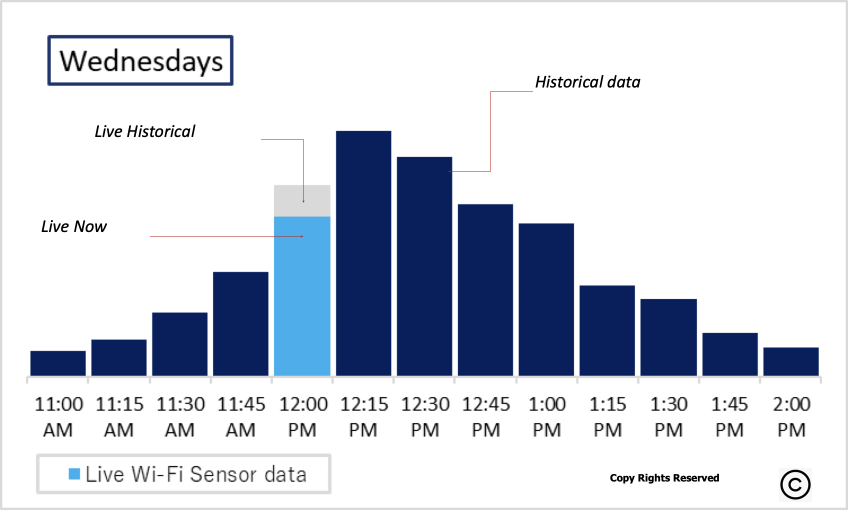
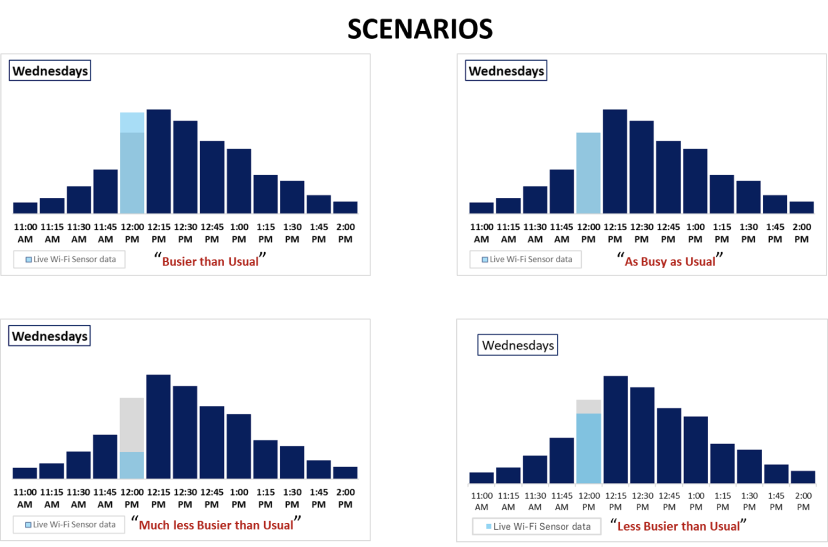
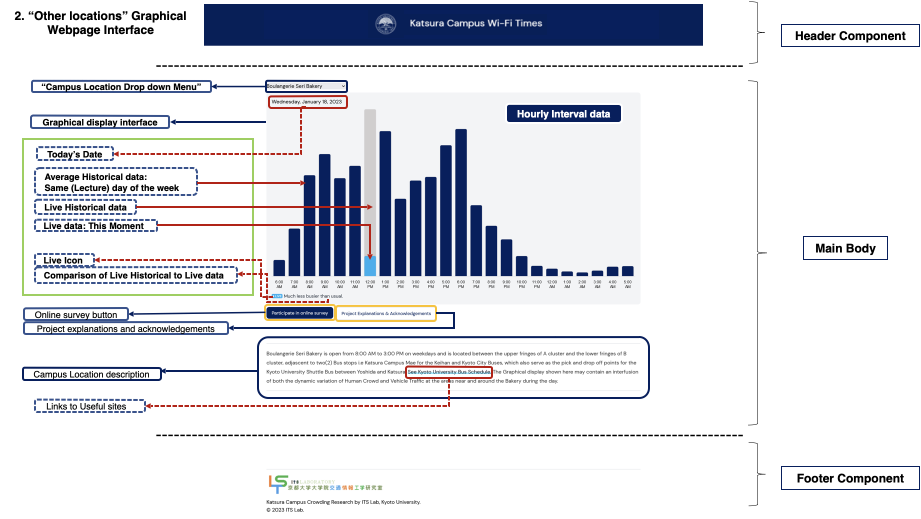
Although the Graphical display interfaces differ, see illustrations below i.e., “Cafeteria Sensors in 15 Minute Intervals” (11:00AM – 2:00PM) and “Other locations sensors in Hourly intervals” (6:00AM – 5:00PM), Both operate upon the same principle as here explained. For any location on the drop down menu, The bar graph shows the relative “busyness” of the location at a particular time on a typical day of the week, based on the average Wi-Fi crowd traffic historical data in Navy Blue (Historical data) of the same (Lecture) day of the week over the past month. If the CURRENT TIME is within the specified range, then the current bar will be highlighted in Light grey (Live Historical data) with an overlay of the live Wi-Fi crowd traffic count (Live data) in Cyan Blue showing how active the location is as compared to its regular Wi-Fi crowd count at that particular time. The peak times during the day are clearly visible from the graphical display and a brief description of the live status for each specific time interval is returned such as; “As Busy as Usual”, “Busier than Usual”, “Less Busier than Usual” , “Much Busier than Usual” or “Much less Busier than Usual” as shown in by the Scenarios in the illustrations below.
Acknowledgements
This project was funded by ”Katsura Campus Empirical Research Promotion Fund". We express our gratitude. Also, we would like to thank the Social System Research Institute for their various supports in operating the WiFi sensors. We greatly appreciate it.
- Social System Research Institute: https://www.jriss.jp/
- Project movie: https://www.youtube.com/watch?v=5fvl1YeWqZE
- Contact email: its-katsura-wifi@trans.kuciv.kyoto-u.ac.jp

